


Modeling Gene Inheritance Probability
Posted by Joshua Bartosiewicz

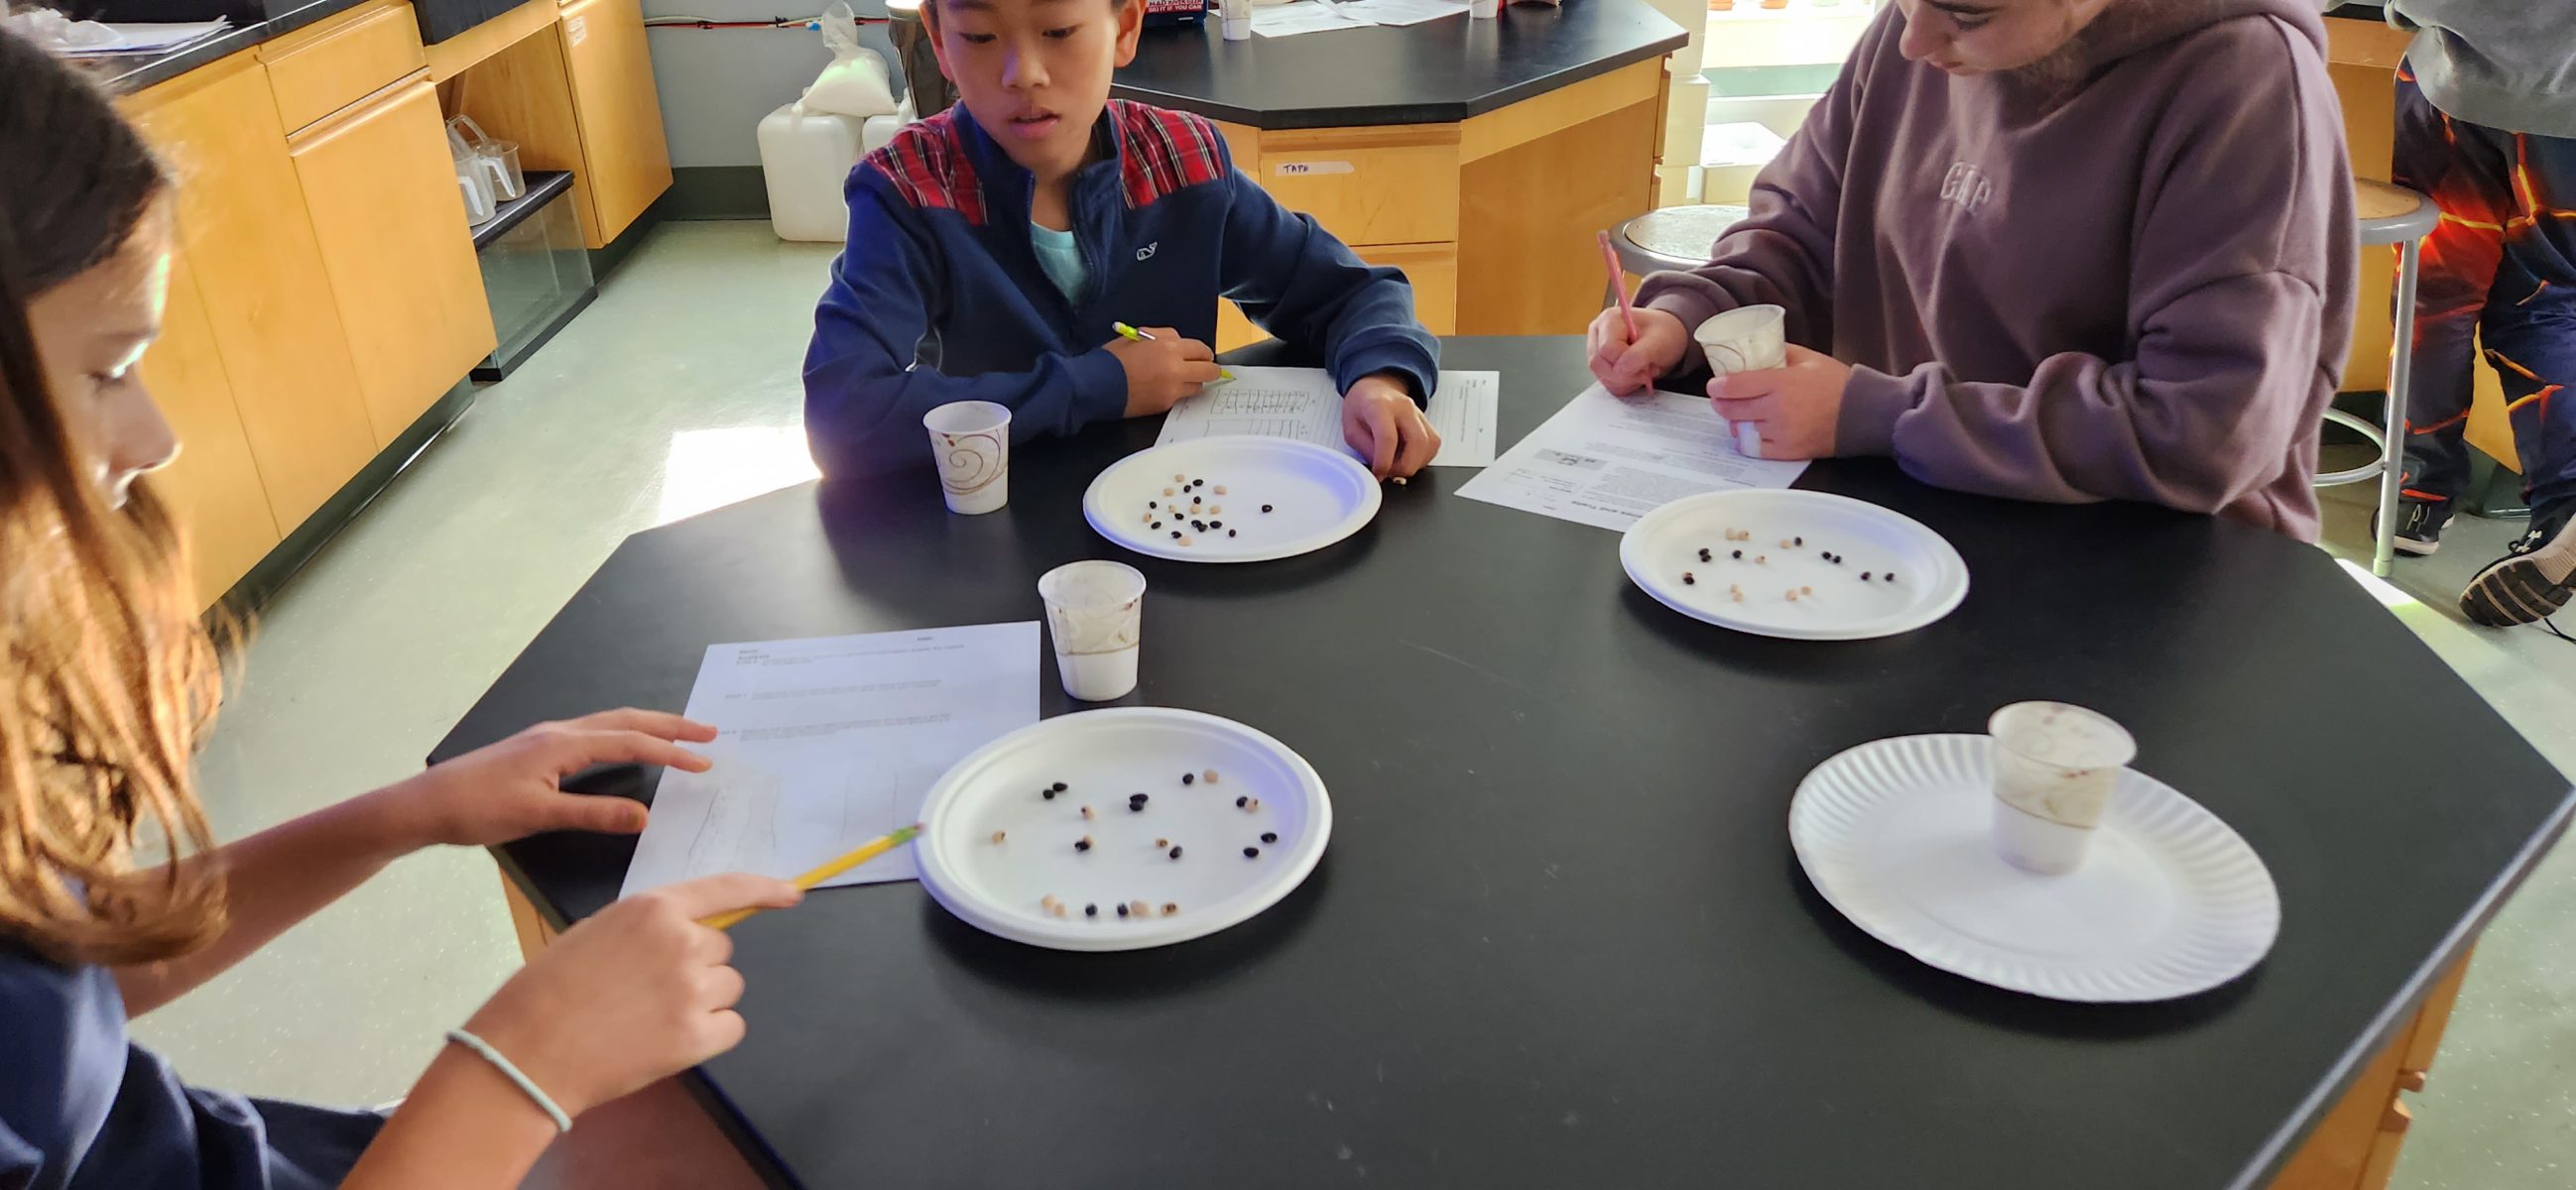
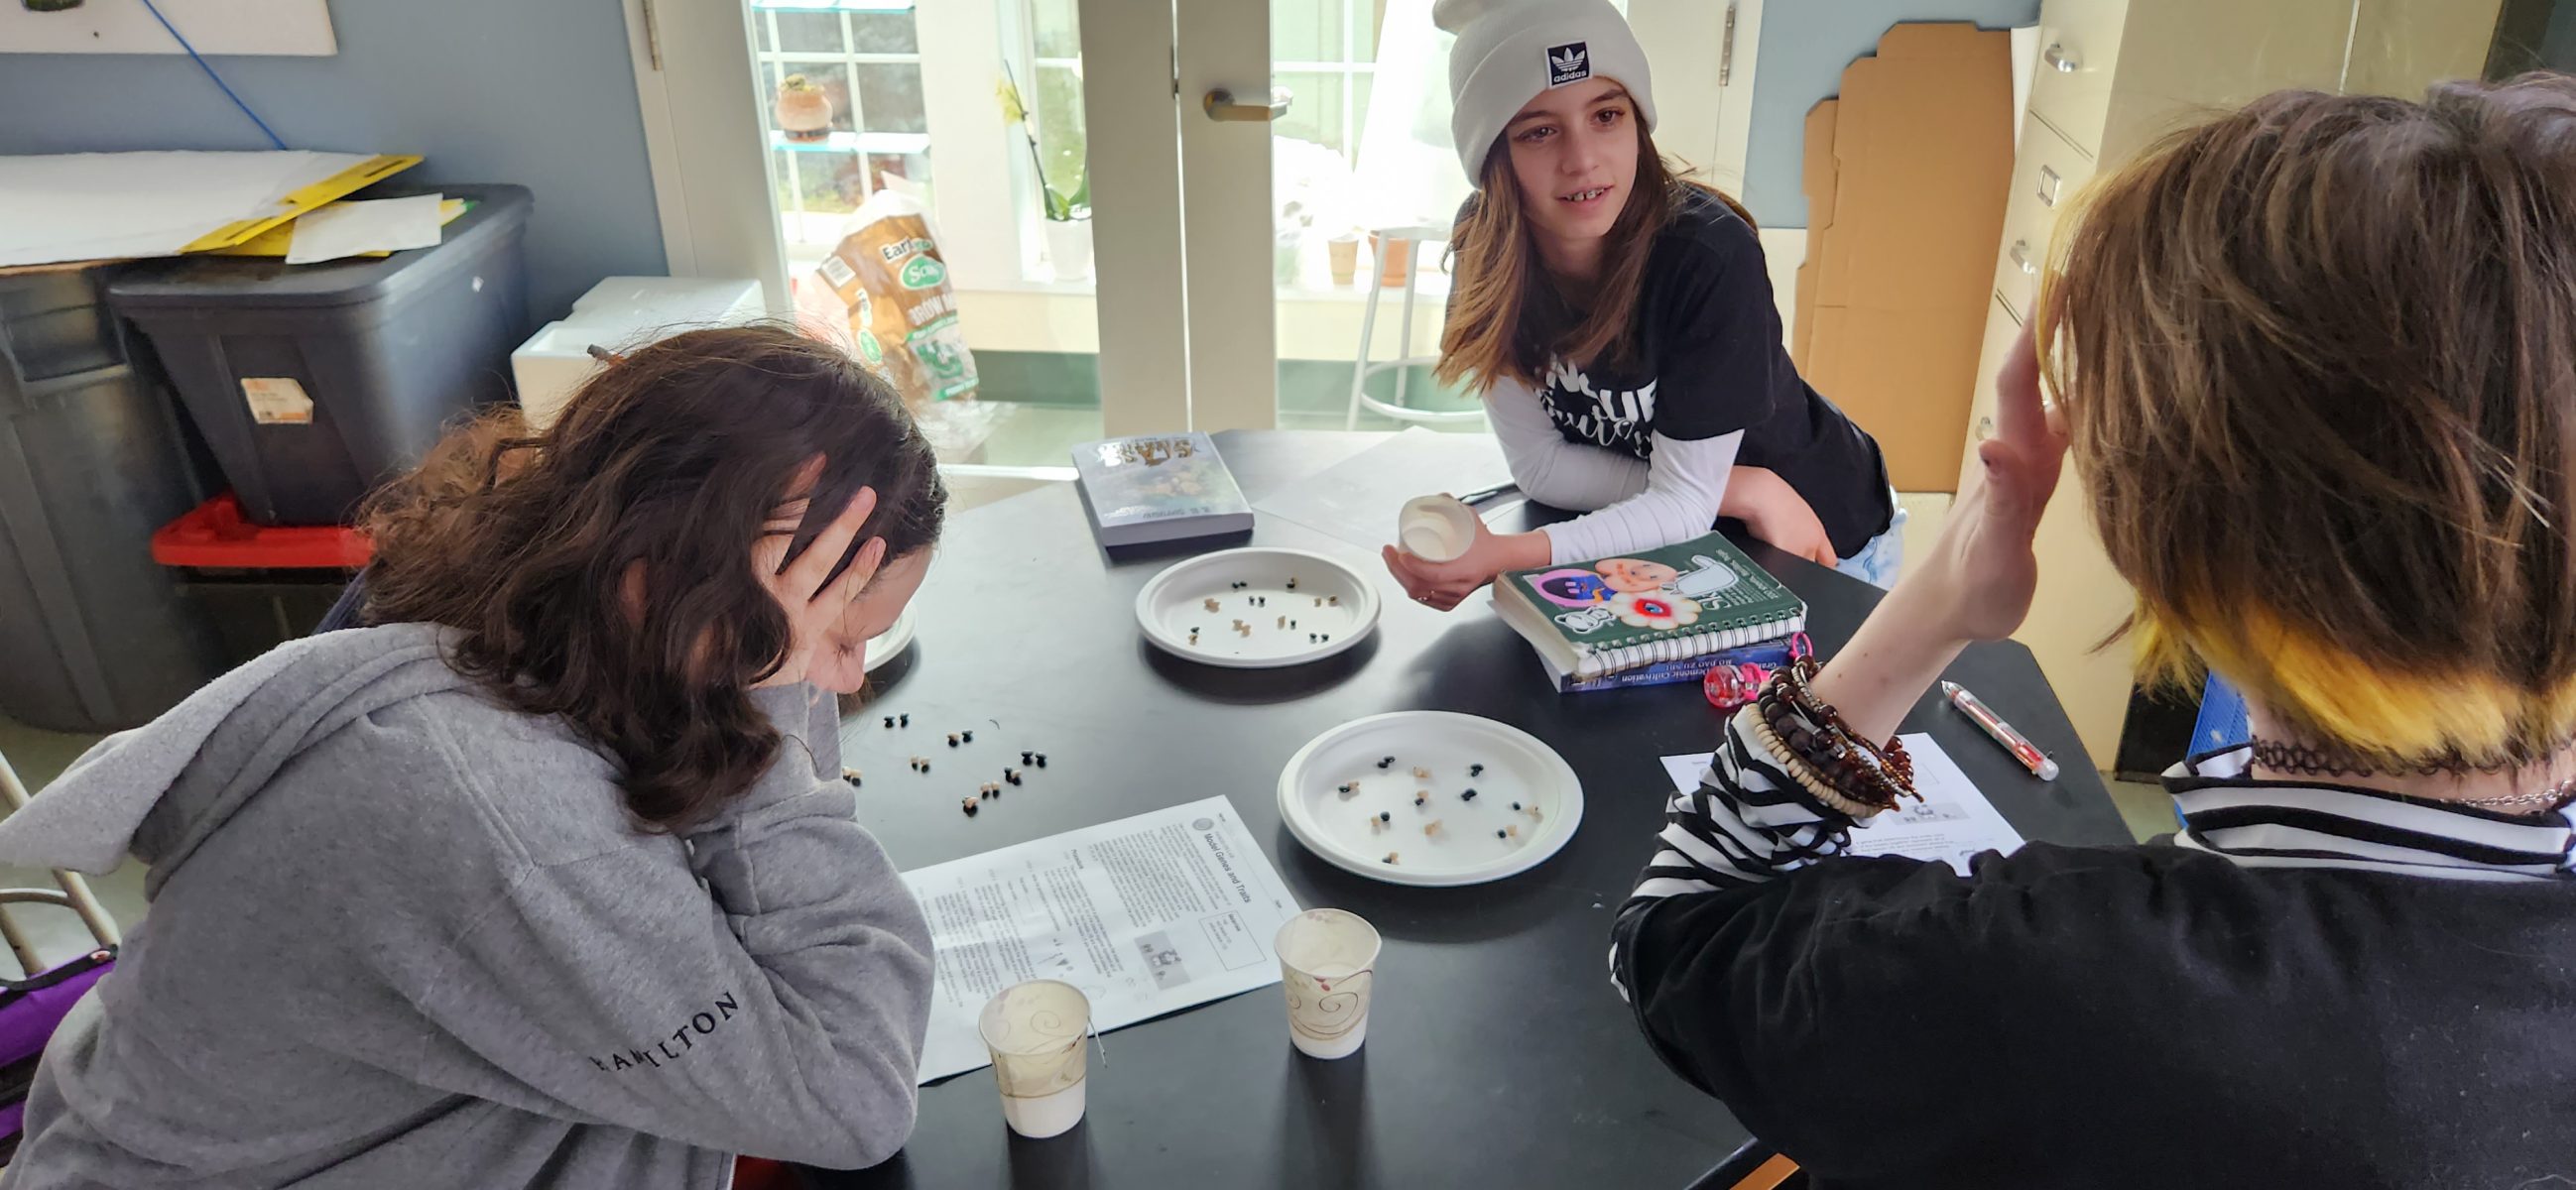
In this activity the 7th graders were modeling Gene Inheritance. Each student was given a worksheet, a Dixie cup, 10 tan beans and 12 black beans. The tan beans represented yellow fish in an aquatic environment while the black beans represented a red colored fish. The yellow color was the recessive trait (rr) in this activity and the red was the dominant trait (RR,Rr). One by one, the students took pairs of beans out of the cup without looking; each pair of beans represented a certain genotype (either “RR” or “Rr” which would be a red colored fish or “rr” which represents a yellow colored fish) and each genotype is shown through the fishes phenotypes (either red or yellow). Once all of the beans were removed from the cup, the students tallied their genotypes (pair’d letters) and phenotypes (characteristic seen based off genotype i.e. red or yellow scales). The students repeated the process but were asked to remove some of the yellow fish beads first; this simulated a drop in population due the presence of red algae which helps the red fish to hide easier from prey. This lab helped students to understand the probability of gene inheritance and how environmental factors can also influence population growth.
← Xīn Nián Kuài Lè,Gōng Xǐ Fā Cái SHAPE! →